Lesson 11: Graphical Representation of Uniformly Accelerated Motion in 1D
Video Lesson
Lesson objective
Dear learners,
At the end of the lesson you will be able to
- Graphically, represent position versus time graph, displacement time graph, velocity time graph, and acceleration time graph of a uniformly accelerated motion in 1d.
- Interpret a graph of velocity vs. time, displacement vs. time and acceleration vs. time.
- Draw graphs from the kinematic equations.
- Determine the velocity of a motion from the slope of displacement-time graph, and acceleration from the slope of velocity – time graph.
- Determine the displacement covered from the area under velocity – time graph.
Brainstorming question
What are dependent and independent variables in drawing graphs, and what is the relationship between them?
Key Terms and Concepts
- Slope of displacement
- Slope of velocity
- The area under the velocity
- Slope
- Constant velocity
- Positive slope
- Negative slope
- Zero slope
Slope of displacement-time graph give average velocity.
Slope of velocity-time graph give the acceleration of the motion.
The area under the velocity-time curve and the time axis gives the magnitude of the displacement covered
Slope is equal to velocity.
Constant velocity is explained by the straight line, while acceleration is explained by the curved lines.
Positive slope means the motion is in the positive direction.
Negative slope means the motion is in the negative direction.
Zero slope means that the object is at rest.
Displacement-Time Graphs
- A graph is defined as a pictorial representation of information which is a two-dimensional drawing explaining the relationship between dependent and independent variables.
- Independent variables are represented on the horizontal line known as the x-axis, while the dependent variables are represented on the vertical line known as the y-axis
- The displacement of an object is defined as how far the object is from its initial point.
- In the displacement time graph, displacement is the dependent variable and is represented on the y-axis, while time is the independent variable and is represented on the x-axis.
- Displacement time graphs are also known as position-time graphs.
The slope of displacement-time graph
Slope is a measure of the steepness of a line. It is given by the equation:
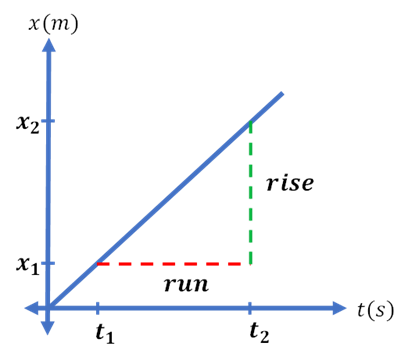
Figure 3.3 Slope of displacement-time graph
$slope=\frac{rise}{run}=\frac{Vertical increase}{Horizontal increase}=\frac{X_{2}-X_{1}}{t_{2}-t_{1}}$
- His expression for slope is the same as the definition of velocity:
- $Velocity=\frac{\bigtriangleup X}{\bigtriangleup t}$
- So, the slope of a position-time graph equals the velocity of the motion.
Displacement-time graph for uniform motion
- A uniform motion is the type of motion in which the object moves in a straight line at a constant speed.
- The velocity of the moving object is constant throughout the motion.
- Displacement-time graph of a uniform motion is the graph between the displacement and time when the motion of an object is uniform, which means the object’s velocity is constant.
- This graph gives a straight line with a non-zero slope. Figure 3.5 (b)
Displacement-time graph for uniformly accelerated motion
- Acceleration is defined as the rate of change of velocity with respect to time. So,
- uniform acceleration of an object can be defined as the amount of change of velocity in equal intervals of time.
- The rate of change of velocity, in this case, is constant.
- The displacement-time graph for uniform acceleration is a graph that gives a curved or a parabolic line because the rate of change of velocity in equal intervals of time changes as the moving object accelerates. Figure 3.5 (c)
- In this case slope is increasing (sloping up or getting steeper), hence velocity is increasing resulting in a positive acceleration.
Displacement-time graph for uniformly decelerated motion
- In the case where the velocity of an object is decreasing, slope is decreasing, resulting to a deceleration Figure 3.5 (d)
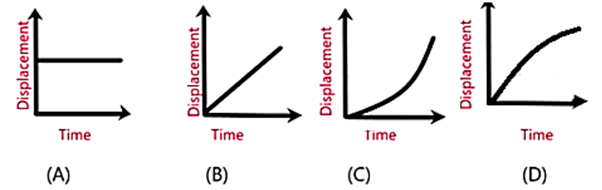
Figure 3.4 Some common displacement-time graphs
Interpreting a displacement-time graphs
- In interpreting or describing the motion of an object, we decide whether the object is moving at a constant speed, accelerating or decelerating or is the object stationary (at rest).
- To understand how to interpret these graphs, we need to know something about the slope of a line.
- The slope of a line on a graph tells you how quickly the quantity being graphed is increasing or decreasing.
- For this purpose, we use the following properties of the slope of a displacement time-graph.
- A flat line (slope equals zero), means that the object is at rest.
- An upwards straight line means that the object is moving forwards at a constant speed.
- For an upward curved line, for each second that ticks on the horizontal time axis, the distance travelled is greater than the second before. In other words, distance is increasing at an increasing rate. We say that the object is accelerating.
- If the line on the distance-time graph curves the other way (when the slope becomes flatter), then the object will be decelerating, as each second the distance travelled is less than the previous second.
- So, the displacement vs. time graphs of Figure 3.5 are interpreted as follows.
- a. shows the graph for an object stationary over a period of time. The slope is zero, so the object has zero velocity.
- b. shows the graph for an object moving at a constant velocity. You can see that the displacement is increasing as time goes on. The slope, however, stays constant (remember: it’s the slope of a straight line), so the velocity is constant. Here the slope is positive, so the object is moving in the direction we have defined as positive.
- c. shows the graph for an object moving at a constant acceleration. You can see that the slope of the curve increases with time (becomes more vertical); thus, the velocity is increasing with time and the object is accelerating.
- d. shows the graph for an object moving at a constant deceleration. You can see
- That the slope of the curve decreases with time (becomes more horizontal); thus, the velocity is decreases with time and the object is decelerating
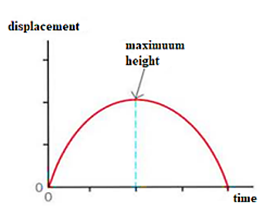
Figure 3.5 Displacement-time graph of an object thrown vertically upward
- The area under the line represents the displacement of the object from its starting position.
- The area between the positive section of the line and the time axis represents the displacement during the ascend.
- The area under the negative section of the line and the time
- axis represents the displacement during the descent.
- Summing up theses two areas gives zero. This corresponds to zero total displacement, because it returns back to the thrown point.
Velocity-Time Graph
- A v-t graph is a graphical representation of different types of motions; the body/object under study exhibits motions by falling under a VT (velocity-time) frame.
- It means that the graph will discuss the motion of the body by seeing the change in its velocity with respect to time.
- The y-axis represents the velocity of the object, x-axis represents the time and
- the slope of the graph is nothing but acceleration .
- While there are three main equations of motion to represent, some other important parts remain too.
- Velocity-time graph represents the first equation of motion, v = u + at.
- A velocity-time graph shows how velocity changes with time.
- In drawing velocity- time graph, we record velocity and time for the motion, and the velocity (the dependent variable) is plotted on the Y-axis, and time (the independent variable) is plotted on the X-axis.
- That is vertical axis represents the velocity of the object, and the horizontal axis represents the time taken.
- This is just the expression for acceleration. So, the slope of a velocity graph represents the acceleration of the motion.
- Because the slope is the same at all points on this graph, the acceleration is constant.
- We can also get the displacement travelled from the velocity vs. time graph by finding the area of the region between the line and the time axis.
Note:
- The slope of a velocity-time graph gives the acceleration.
- The area between a velocity-time graph and the `time’ axis gives the displacement of the object.
- The velocity-time graph for
- a) uniform motion,
- b) uniformly accelerated motion, and
- c) uniformly decelerated motion is shown in the Figure 3.8, below
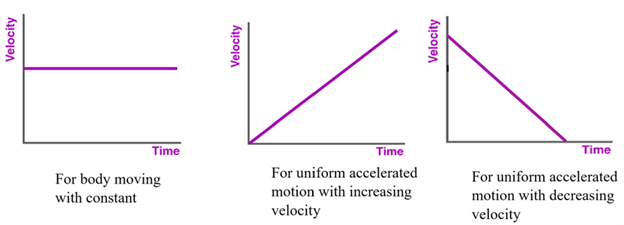
Figure 3.5 Some common velocity-time graphs
Examples:
Calculate the distance travelled, represented by the red-line of the velocity-time graph
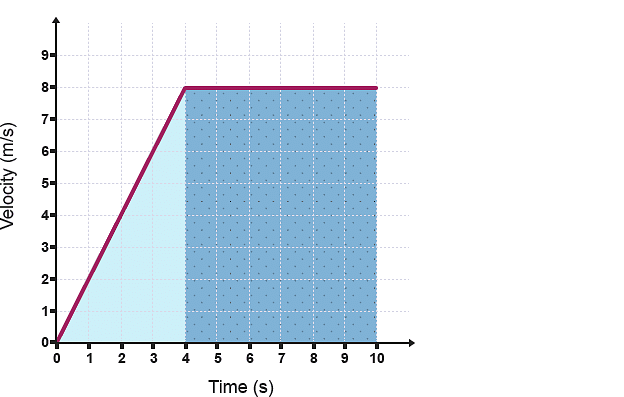
- Calculate area of triangle
= ½ x base x height
= ½ x 4 x 8
= 16 m
- Calculate area of rectangle
= length x breadth {∴ length = 10-4 = 6}
= 6 x 8
= 48 m
So, total distance travelled is, area of triangle + area of rectangle
= 16 + 48
= 64 m
Acceleration-Time Graph
- Acceleration-time graph shows how acceleration changes with time.
- In drawing acceleration-time graph, we record acceleration and time for the motion, and the acceleration (the dependent variable) is plotted on the Y-axis, and time (the independent variable) is plotted on the X-axis.
- In this section, we will only deal with objects moving at a constant acceleration, thus all acceleration-time graphs are parallel to the time axis.
- Figure 3.10 below shows acceleration vs. time graph of a uniform motion (a), a uniformly accelerated motion (b), and a uniformly decelerated motion (c)
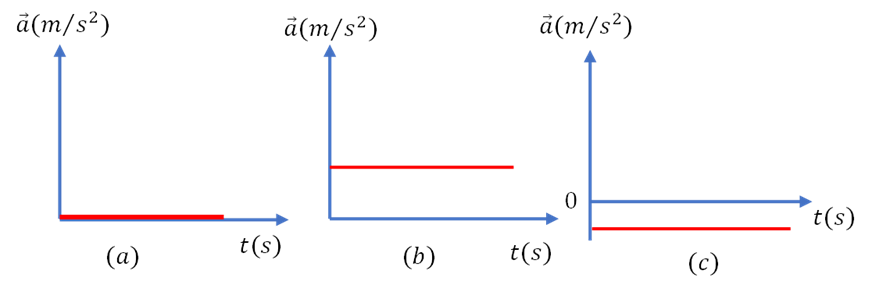
Figure 3.6 acceleration-time graph of (a) uniform motion, (b) uniformly accelerated motion, (c) uniformly decelerated motion.
Examples:
When the initial velocity (v0) is 0 which starts from the rest time i.e. (t0) and the acceleration time graph is shown in the below figure, then what will be the maximum velocity?
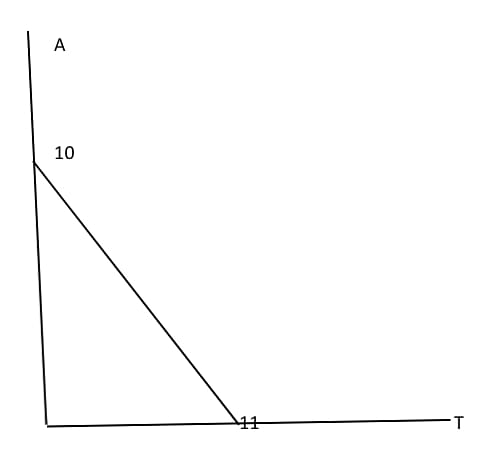
Ans. Here, the acceleration is positive till the end indicating that the velocity increases continuously but not constantly for 11 seconds. Hence, the area will represent the change in velocity (area).
Area= ½ * 10*11 = 55
ΔV= 55 m/s.
Hence, maximum velocity at V0=
= 0m/s + 55m/s
= 55m/s2